




YouTube RPM tells you what 1,000 views paid you after YouTube took its share. Almost everyone quotes it wrong. This post is for YouTubers who want a real range for their niche and their viewers’ countries before they plan a channel, a video or a rent payment. We took two datasets that explain how they measured, put them in tables with their dates, and checked the revenue rules against YouTube’s own help pages.
One gap made us write it. In a 300-channel study, the median Education & Science channel earned $10.22 per 1,000 views. The median Kids & Teens channel earned $0.33, which per million views comes to roughly $10,220 against $330, on the same platform in the same year.
Same views. Different cheque.


YouTube RPM and CPM measure two different people’s money
YouTube’s help page on RPM vs CPM defines both, and its definitions are clearer than most of the videos made about them. RPM (revenue per mille) is what you earned per 1,000 views. CPM (cost per mille) is what advertisers spent per 1,000 ad impressions. Mille is Latin for thousand. It is the only Latin most creators will ever need.
The differences add up fast. Your YouTube RPM is counted after YouTube’s revenue share, and CPM before it. RPM also counts every view, including the ones where no ad played, while CPM counts only impressions that actually carried an ad. It counts more than ads, too. Memberships, YouTube Premium revenue, Super Chat and Super Stickers all go in. So YouTube RPM is your total income per thousand views. Not an ad price.
The revenue shares are on YouTube’s partner earnings overview. On long-form videos, a creator who accepts the Watch Page Monetization Module gets 55% of net ad revenue. On Shorts, it is 45% of the revenue allocated to you from the Creator Pool, which works very differently (more on that pool below).
So a $12 CPM does not put $12 in your pocket. Not even close. It means advertisers paid $12 for each 1,000 ads that ran. YouTube keeps 45%, and what is left gets spread over every view, including all the views that showed nothing, which is how a respectable CPM turns into a two-dollar YouTube RPM and a confused face.
YouTube publishes no rates, so here is where ours come from
YouTube does not publish RPM by niche or by country. Every table online that says “finance RPM: $25” got its number from somebody, and that somebody is often another calculator page. We nearly copied one. Then we went looking for the data behind it and found a second blog, which cited the first one. (We closed the tab.)
This post uses two sources that state their method:
- AIR Media-Tech, a company that works with YouTube channels, read Studio analytics from 300 of its channels for every monetized month from May 2025 to May 2026, which is 3,595 channel-months. It reports medians. The page was last updated on 1 July 2026.
- Dynamoi, a music promotion company, publishes aggregated, anonymised rates from YouTube Analytics accounts connected to its platform. It covers 74 markets from 22 October 2025 to 21 October 2026 and does not say how many channels or which niches.
Each company is showing you its own clients. Neither one is YouTube. So read every number below as “what a real group of channels earned”, not “what you will earn”. That is still better than a number nobody measured.
YouTube RPM by niche: education on top, kids at the bottom
These are AIR Media-Tech’s median YouTube RPM figures for long-form video, from its 2026 niche ranking. The P25 to P75 column is the middle half of channels: a quarter earned less than the low figure, and a quarter earned more than the high one.
| Niche | Median RPM | Middle half (P25 to P75) | Note |
|---|---|---|---|
| Education & Science | $10.22 | $2.31 to $19.50 | |
| Transport | $5.69 | $3.17 to $9.81 | fewer than 10 channels |
| Lifestyle | $2.98 | $1.77 to $5.24 | |
| News & Politics | $2.60 | $1.79 to $3.62 | fewer than 10 channels |
| Entertainment | $2.43 | $0.88 to $5.02 | |
| Crafting & Handmade | $2.39 | $1.00 to $3.90 | |
| Gadgets & Tech | $2.33 | $0.70 to $3.71 | |
| Music | $2.28 | $1.35 to $4.16 | |
| Food & Cooking | $2.25 | $1.50 to $3.11 | fewer than 10 channels |
| Gaming | $2.05 | $0.70 to $3.62 | |
| Business & Finance | $2.01 | $0.73 to $5.17 | fewer than 10 channels |
| Health & Sport | $1.23 | $0.72 to $1.53 | |
| Kids & Teens | $0.33 | $0.16 to $0.88 |
Source: AIR Media-Tech, 300 channels, YouTube Studio data, May 2025 to May 2026, page updated 1 July 2026.
Business & Finance sits near the bottom, which goes against every “pick finance, get rich” thread. But that row rests on three channels. Three. AIR marks it as directional, so don’t treat it as a law of nature. Just notice that the famous finance RPMs all come from people selling courses about finance RPMs.
The niche medians hide a bigger gap inside each niche
Gadgets & Tech is the better lesson. Its median Studio CPM ($5.73) is close to the top of the table, yet its YouTube RPM is only $2.33, because just 34% of its views served an ad. Education monetized 77%. The ad price was similar, but far more of education’s views actually carried an ad.
Spread within a niche matters even more. In education, the top quarter of channels earned 8.4 times what the bottom quarter earned. AIR’s own conclusion is that how a channel is run moves its earnings more than the topic it covers, which is less exciting than a niche ranking and a lot more useful.
Kids & Teens is at the bottom for a legal reason, not a taste reason. Content marked as made for kids cannot carry personalised ads under COPPA, the US children’s privacy law, so advertisers pay less for it. We spent a while arguing about whether a cartoon on compound interest would count as finance or kids. Anyway.
YouTube RPM by country: you are paid where your viewers live
Your passport does not set your rate. Your viewers’ location does, because advertisers bid by market. Dynamoi’s table shows how wide the YouTube RPM gap gets between markets, from Australia at the top to Indonesia at the bottom. Playback CPM here means advertiser spend per 1,000 monetized playbacks, before YouTube’s share.
| Market | Creator RPM | Playback CPM |
|---|---|---|
| Australia | $7.08 | $15.28 |
| Norway | $6.35 | $13.66 |
| United States | $5.12 | $12.45 |
| Canada | $5.04 | $10.70 |
| United Kingdom | $4.65 | $11.55 |
| Switzerland | $4.42 | $11.09 |
| Japan | $2.60 | $5.60 |
| Germany | $1.37 | $8.95 |
| France | $1.33 | $6.99 |
| Philippines | $0.67 | $1.40 |
| Mexico | $0.27 | $1.98 |
| Indonesia | $0.14 | $1.04 |
| Global | $1.14 | $2.53 |
Source: Dynamoi, connected YouTube Analytics accounts, 22 Oct 2025 to 21 Oct 2026, updated 21 Oct 2026. USD per 1,000 views.
The global figure needs a warning. Dynamoi’s $1.14 global RPM is half of AIR’s $2.30 median, because the two samples cover different channels. Dynamoi sells music promotion, so its client list probably leans towards artists, and music channels pull in views from every country, cheap markets included.
Germany has a decent CPM and a weak RPM
We planned to show just one country table. Then Germany turned up with an $8.95 playback CPM and a $1.37 RPM in the same row, and we had to work out which number was lying. Probably neither. CPM only counts playbacks that had an ad, while YouTube RPM is spread across every view after YouTube’s share. So a market with plenty of ad-free views can show a healthy CPM next to a weak RPM. Dynamoi doesn’t explain the gap, so take that as our reading rather than its finding.
AIR has a separate country table of advertiser CPM, built from data on more than 3,000 channels and published in June 2025, so it is older than everything else here. At the top, the US is at $14.67, Australia at $13.30 and Switzerland at $12.98. India sits at $0.74, and Pakistan and Bangladesh at $0.53 each, which is roughly a 28-fold gap for the same 1,000 ads. Use it to rank countries. Not to budget.
YouTube Shorts RPM comes from a shared pool
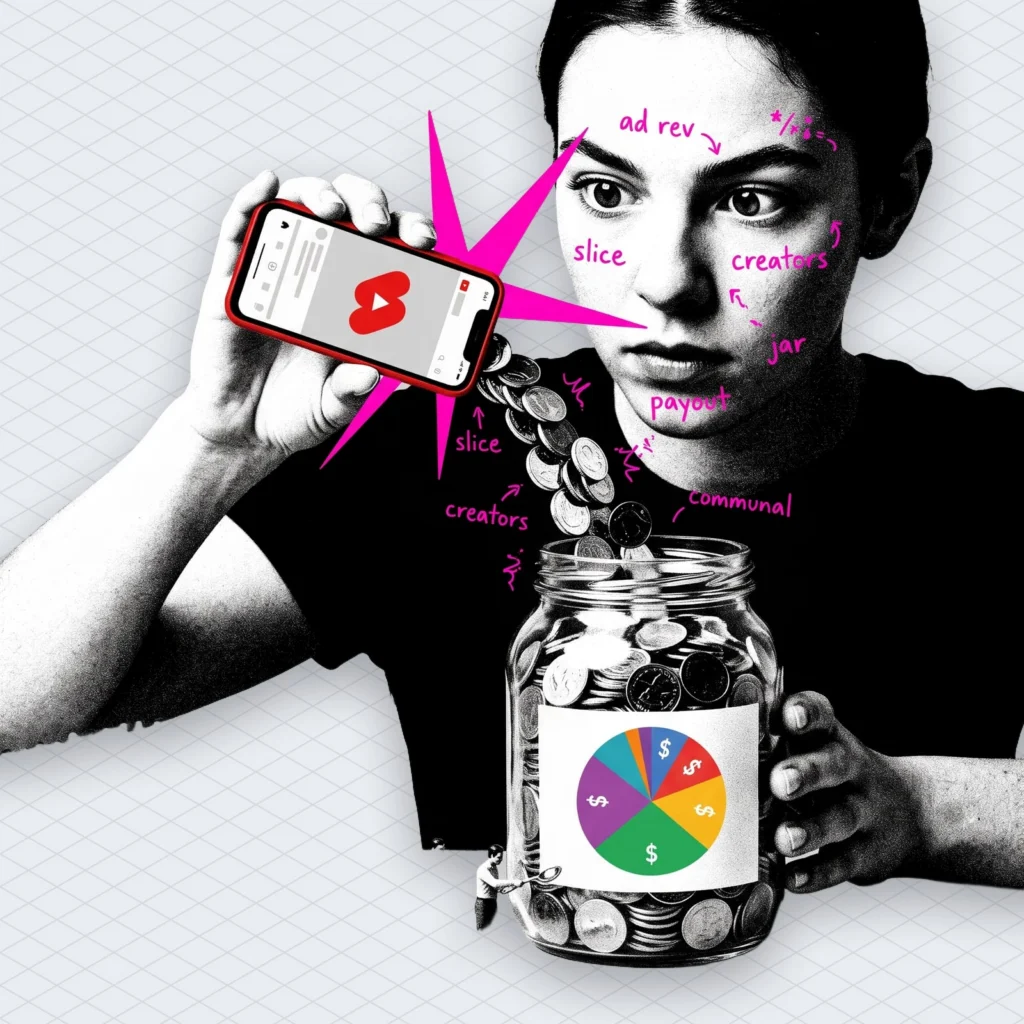
Shorts don’t pay per ad shown next to your video, because ads run between Shorts in the feed. YouTube’s Shorts monetization policy explains the rest. Each month, ad revenue from the Shorts Feed is pooled. Part of it goes into the Creator Pool, which is split among monetizing creators by their share of engaged views in each country. You keep 45% of your allocation.
Music changes the size of the pool. Not your slice. If a Short has no music, all of its revenue goes into the pool, and if it uses music, part of it pays for licensing, depending on how many tracks it uses. YouTube says using music won’t affect a creator’s allocation or revenue share rate. So the licensing cost lands on everyone a little, which is about as fair as splitting a restaurant bill because one person ordered the lobster.
Shorts RPM is counted on engaged views, not all views, so it can’t be compared directly with long-form YouTube RPM. In AIR’s 274-channel Shorts data, Shorts RPM ran from $0.02 to $1.48 depending on niche. That is roughly 3% to 14% of what the same niche earns on long-form, and music is the only niche where the gap closes. By audience country, AIR measured $0.328 per 1,000 Shorts views for the US, $0.193 for Australia, $0.166 for the UK and $0.165 for Canada.
To get into the program, you need 1,000 subscribers plus either 4,000 long-form watch hours in the past year or 10 million Shorts views in the past 90 days, according to YouTube’s Partner Program page. If Shorts are your main format, our short video earnings calculator turns monthly views into a range for YouTube, TikTok and the rest.
How to raise YouTube RPM without changing your topic
The niche table makes it look like the topic decides everything. It doesn’t. Most of the levers below work in any niche. None of them needs you to start a credit card review channel.
Length comes first. YouTube allows mid-roll ads only on monetized videos that are 8 minutes or longer, and it places automatic mid-roll slots by default. AIR calls ad load “the lever you control most directly”. A ten-minute video can hold several mid-rolls, it adds, while an eight-minute one struggles to hold one, and its median monetized view carried about 1.55 ads. Don’t pad a video to reach a slot, though. A viewer who leaves at minute four sees no mid-roll at all, and that empty view still counts in your YouTube RPM.
Next is your monetized playback share, meaning how many of your views actually carry an ad, which depends on who is watching, where they are and what the content is. Gadgets & Tech bled out here. In YouTube Studio, put playback-based CPM next to RPM for the same videos. A huge gap means views without ads, not low prices.
Audience location comes third, and you control it more than it seems. You can’t move your viewers. Your language, examples, upload times and the problems you solve still decide which markets find you. A channel that speaks to Canadian renters will collect Canadian views.
The calendar and live income move the number too
Then there is the calendar. In AIR’s pooled data, median YouTube RPM peaked at $2.35 in November and fell to $1.56 in January, about a third lower. Business & Finance had the biggest Q4 premium (+60%), Entertainment the smallest (+4%). So publish your strongest video in November, not in the first week of January, when advertisers are recovering too. If that video is a holiday one, here is what you can and can’t use for Christmas music, because the season is also when claims pile up.
Last, there is income that has nothing to do with ads. Memberships, Super Chat and Super Stickers count toward YouTube RPM, so a channel with an active live audience can raise it without a single extra ad. Our streamer earnings calculator shows what live streams pay on YouTube next to Twitch, Kick and TikTok.
Music claims quietly send your revenue somewhere else
This one doesn’t appear in any RPM table, and it is the easiest money to lose. When a video gets a Content ID claim (YouTube’s automatic match against rights holders’ files), the owner’s policy decides what happens. Block, monetize or track. If the policy is to monetize, the owner runs ads and earns the revenue, “sometimes sharing revenue with the uploader”. YouTube’s earnings page also says estimated revenue gets adjusted for Content ID claims and disputes, so a number you saw in Analytics can shrink before it ever reaches payday.
From the outside it looks like a bad YouTube RPM. Your views are fine and your ads are running. They just pay somebody else.
According to Mubert’s own data for the last 28 days, about one in four tracks people ran through our copyright checker (26%) came back with a rights holder’s claim, slightly down from 26.8% in the period before. Those were tracks people were about to use. So the check happened before the upload, not after the money moved.
The fix is boring. Know where every piece of music in a video comes from and what its licence covers on YouTube. If you need background music written for a specific video, Mubert Render generates an original track at the exact length you ask for. It is built from samples that real artists upload and get paid for, and it is cleared for commercial use under the platform licence. The exact scope depends on the plan, so read the plan before you assume.
A checklist for a higher YouTube RPM this week
- Compare RPM with playback-based CPM for your last ten videos in YouTube Studio.
- Check who watched your low-ad videos, and from which countries.
- Turn on automatic mid-rolls.
- Move any mid-roll that cuts a sentence in half.
- Make your next long-form video 8 minutes or more only if the content fills that time, because padded minutes lose viewers before the slot arrives.
- Write your next video for the country that already pays you best.
- Move your strongest planned video into November.
- List every track in your top five videos with its source and licence.
You can’t pick what an advertiser in Oslo pays for a view. You can pick the length, the music, the month and who you speak to, which is more of the number than any niche table admits. Same views, different cheque. Now you know which parts of your YouTube RPM are yours.


 Who we are


